Divorce Recession Drop Rebound
Editor's note: Special thanks to Stephanie Coontz for bringing this post to our attention.
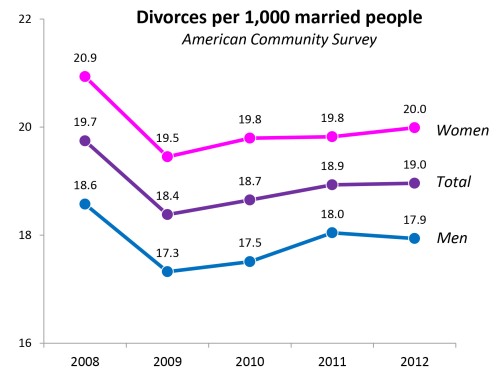
The Census Bureau’s American Community Survey is the best annual national data source for marital events. The 2012 data came out recently, and I don’t believe anyone else has published a divorce rate for 2012. The refined divorce rate -- the number of divorces per 1,000 married people -- was 19.0 in 2012. Here is the trend since the ACS starting counting divorces:
What does this mean? It’s a shame the ACS didn’t start counting marital events till 2008, because it means we can’t put that year’s high rate in context. Was it (a) a spike up, suggesting divorce was a leading indicator for the recession; (b) part of a consistent decline, suggesting the the years since have been a pretty substantial increase from the historical trend; or, (c) a data anomaly.*
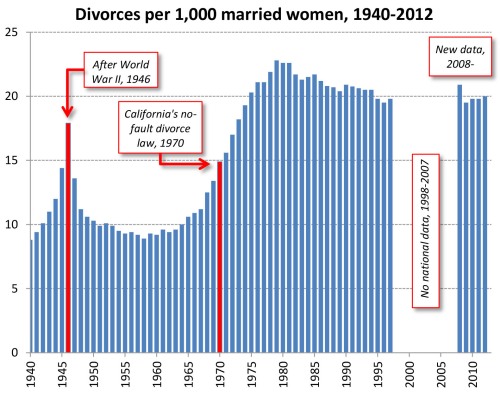
To put this in the context of the larger trend doesn’t really help answer the question, since we switched from vital records to a national survey, and had a decade with no national statistics in between:
So, it’s a mystery. My preferred interpretation is still that the recession caused a decline in divorces because disgruntled people were tied up in other crises, couldn’t sell their houses, or couldn’t afford to move out, followed by a rebound of accumulated divorces to our current level.
I published a working paper suggesting something like this in 2012, and have a more recent version under review now that goes through 2011. In the new version I use 2008 predictors of divorce and estimate that 4 percent fewer divorces occurred through 2011 compared to what would have been expected had the determinants of divorce not changed in the subsequent years (ask me for a copy).
My blog series on divorce includes previous reports on rates, and attempts to predict divorce rates using Google searches.
Technical addendum
To replicate my rates for 2012, you start here at the FactFinder, then get the number of married people by sex (ACS Table B12001) and the number of people who got divorced in the 12 months before the survey (ACS Table S1251) -- you can enter the table numbers into the search box. There is a slight problem with this, however. Some people who say they got divorced in the past twelve months also say they are currently married (presumably remarried already). Those people are counted twice in the denominator of the FactFinder-based divorce rate -- once as divorced people and once as currently married. If you download the public-use file and count those people only once in the denominator, the divorce rate rises by .02 per 1,000 (or 2 people per 100,000) -- but this would not change the figures above at the level of precision reported. However, the public-use files produce slightly different estimates than the FactFinder files anyway, because the latter are based on the Census Bureau’s complete file not a subsample, so I use those even though they produce this tiny under-estimate of the divorce rate.
Secondly, what about the difference in divorce rates between men and women? This is a survey, not a vital records count, and there is no way to verify with the now-missing spouses whether they also consider themselves divorced. Maybe they weren’t legally married, or they didn’t really get legally divorced. So there are several possibilities: (a) lots of lesbian divorces, which is unlikely given the small number of lesbian marriages (but note we don’t know the sex of the spouse who is no longer in the household so we can’t distinguish homogamous from heterogamous divorces); (b) women are more likely to describe a breakup as a divorce for reasons unknown; (c) something funky with the survey weights (unweighted divorce rates from the public-use file also show the disparity, but it’s 20 percent smaller), or; (d) something funky with the sampling.
Who knows! If you are reading this and considering a new career -- or a new direction in your existing career -- consider becoming a family demographer and helping us figure it out.

